For technical teams

Architecture

A thin Django application acts as the API, the notebook index, and the job orchestrator. Celery workers do the heavy execution; MyST renders to static HTML; object storage distributes it. It’s a stack the IFRC GO team already builds and runs.

System diagram Run sequences The stack & why Data model Sharp edges
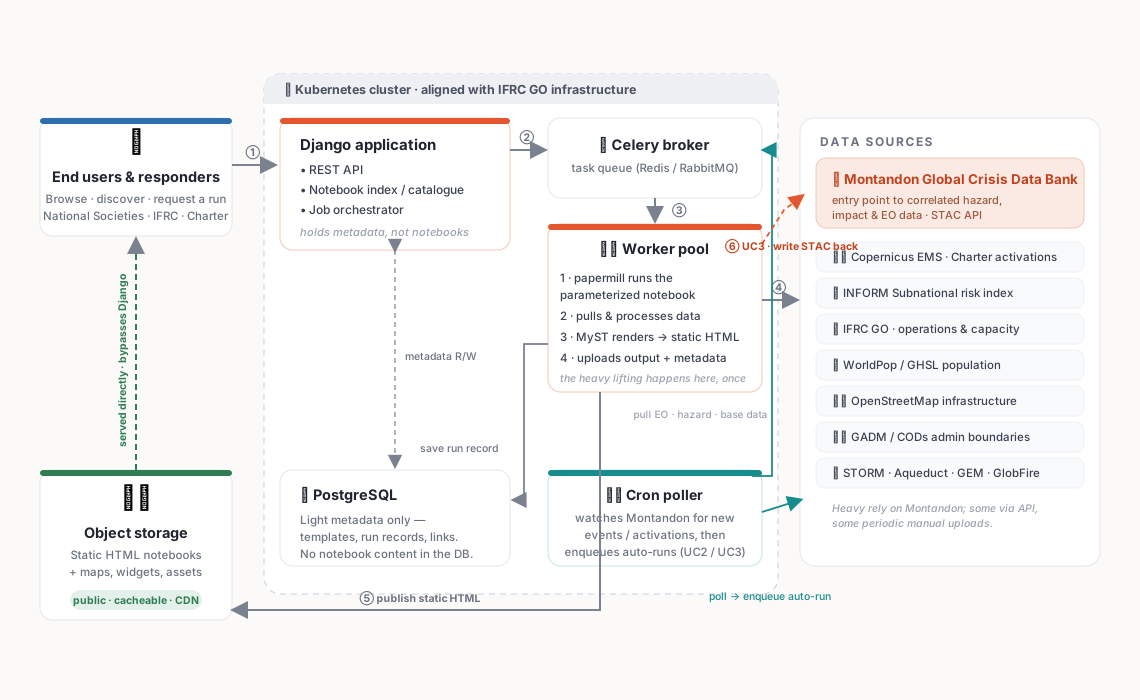
System architecture: frontend, Django API, PostgreSQL, Celery broker, worker pool, cron poller, data sources and object storage on Kubernetes
System diagram The full picture β€” request, orchestrate, execute, publish, and serve. Auto-runs (cron poll) and the UC3 write-back are shown as distinct edges.
Key

Django holds metadata only. Templates, run records and links live in Postgres β€” never notebook content.

Key

Outputs bypass the app. Static HTML is served straight from object storage, so the app is never in the hot path for reads.

Key

Workers do the heavy lifting. papermill executes; MyST renders; data pulls & processing happen here, once per run.
Control flow

How a run flows, step by step

Two paths, same pipeline: a user requests a run, or the system starts one from a new event.

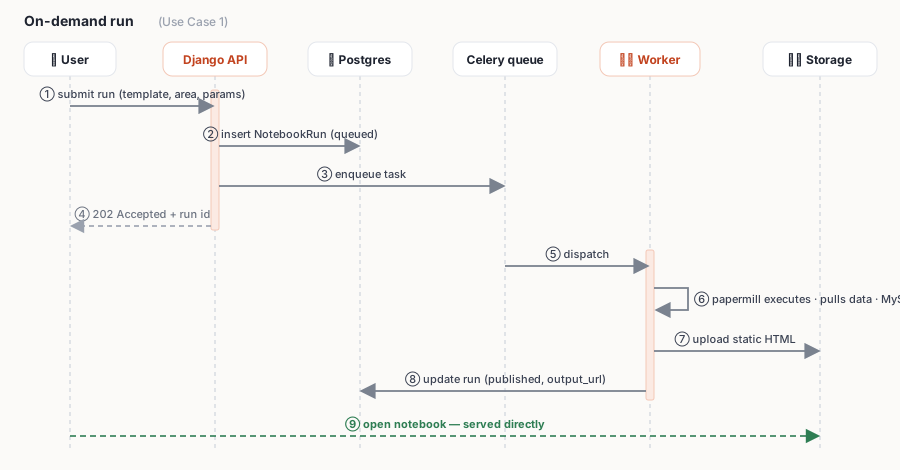
Sequence diagram of an on-demand run across user, Django, Postgres, Celery, worker and object storage
The user submits parameters; Django records the run and enqueues a task; a worker executes, renders and publishes; the user opens the result directly from storage.
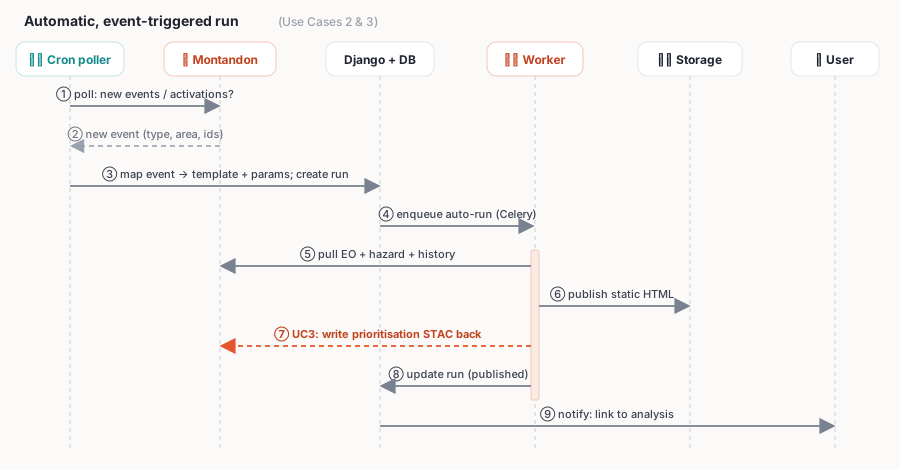
Sequence diagram of an automatic run: cron poller, Montandon, Django, worker, storage and user, including the UC3 STAC write-back
A cron poller spots a new event, maps it to a template + parameters, and enqueues a run. For UC3 the worker also writes the prioritisation back to Montandon, then the user is notified.

Technology choices

The stack, and why each piece

🟩

Django + Celery + Kubernetes

The API, notebook index and orchestrator. Celery manages the job queue; workers scale on k8s. Why: this is exactly the stack the IFRC GO team builds and maintains β€” well-understood, well-integrated, low long-term maintenance risk.

πŸ““

papermill

Executes a notebook with injected parameters, producing a fully-run notebook. Why: the standard tool for parameterized notebook execution β€” turns a template + a parameter set into a concrete run.

πŸ“„

MyST

Renders the executed notebook to a clean, self-contained static HTML page. Why: high-quality notebook β†’ web rendering, and it carries interactive widgets into the static export.

πŸ—ΊοΈ

lonboard Β· anywidget Β· manywidgets

The visualization layer: fast maps (lonboard) and composable widgets (anywidget / manywidgets). Why: they render interactively in static HTML with no kernel β€” sliders, toggles and filters keep working on the published page.

πŸ—„οΈ

Object storage

Holds the published HTML + assets, served directly (and cacheable via CDN). Why: cheap, durable, infinitely scalable reads; keeps the app and DB out of the read path.

🌐

Montandon & data sources

Montandon is the entry point to correlated hazard, impact and EO data, plus historical records; other sources (INFORM, CEMS, WorldPop, OSM…) are pulled by the worker. Why: a deliberate, heavy reliance on Montandon as the harmonised backbone.

In plain terms

A template is a recipe. The app takes the recipe plus your choices, hands it to a worker that cooks it once, and puts the finished dish on a shelf (object storage) that anyone can pick up. The app just keeps the menu and the labels.

Data model

What the database actually stores

Light metadata and links β€” enough to orchestrate runs and power discovery. Never the notebooks themselves.

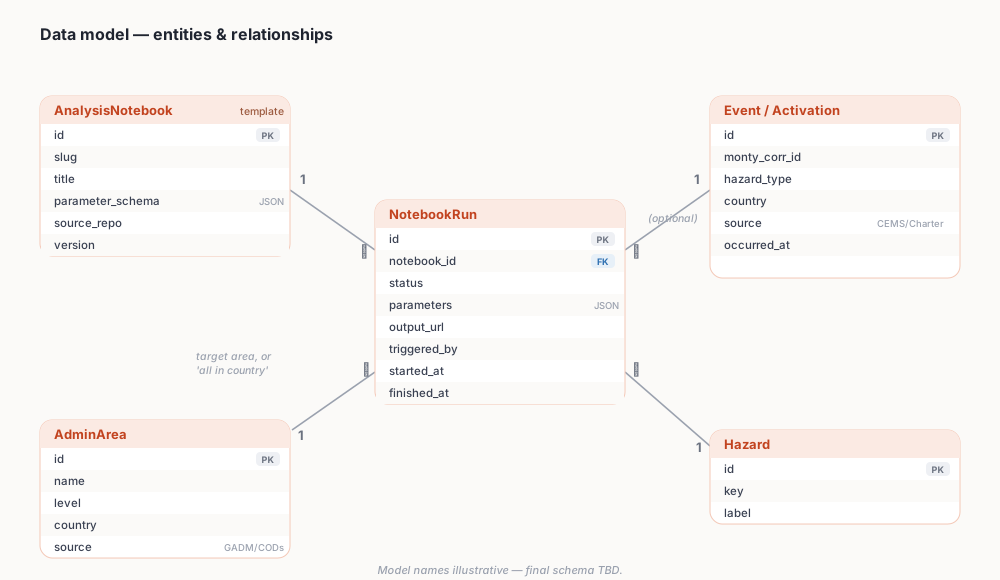
Entity-relationship diagram: AnalysisNotebook, NotebookRun, Event/Activation, AdminArea and Hazard
Illustrative schema Model names are illustrative β€” the final schema is TBD.

AnalysisNotebook

The template: slug, title, parameter_schema, source repo & version. One template β†’ many runs.

NotebookRun

One execution: the parameters used, status, output_url, timestamps, and who/what triggered it. Links to an area, a hazard and (optionally) an event.

Event / Activation

A disaster or CEMS/Charter activation β€” monty_corr_id, hazard type, country, source, time. Ties auto-runs (and UC3 write-back) to the real event.

Honest engineering

Known sharp edges

The pieces around notebook generation and static publishing are well-trodden. The genuinely experimental part is last-mile visualization.

Open

Raster layers in static HTML. Some analyses need raster / x-y-z tile layers rendered in the exported page. That requires the tiles to be served from somewhere; it’s the area most likely to need path-finding on real use cases. Best de-risked early with actual data.

Tunable

Execution time & cost. Ingesting multiple large data sources per run can be slow. This is a known Jupyter problem-space with many knobs β€” caching, resolution, pre-processed inputs, worker sizing.

Growth

Once the basic structure exists, natural extensions come cheaply: on-demand runs in new countries / with different parameters, adding arbitrary analysis notebooks, and feeding EOC field observations in as one more signal for UC3 β€” without changing the method.