Risk → Impact → Action

Three use cases, one pipeline

Each use case answers a different question in the disaster timeline, and each builds on the one before. All three run as parameterized notebooks on the same infrastructure — they differ in their data, their method, and how they are triggered.

① Risk Exposure ② Impact Estimation ③ Response Prioritisation Compare all three
Use Case 1 · Risk · before the event

Population & Infrastructure Risk Exposure

How many people and which assets are exposed to a given hazard, before any event — a baseline for preparedness and planning.

Context

Local decision-makers need up-to-date estimates of exposure to natural hazards: how many children are exposed to recurrent heatwaves, which cities are most prone to cyclones, which airports sit in tsunami-risk zones. The INFORM methodology is the main reference, but its subnational coverage and resolution don’t always fit local needs — so this use case makes the underlying data available with notebooks to compute exposure flexibly, at the resolution and thresholds a user chooses.
Data sources

INFORM Subnational Global Data Lab STORM · cyclone Aqueduct · flood GEM · earthquake GlobFire · wildfire WorldPop / GHSL OpenStreetMap GADM / CODs

Baseline data — a yearly refresh is enough; some via API, some by periodic upload.

Trigger

On-demand

User-driven. Pick an area and parameters in the app and run — for one district, or all Admin-2 in a country.

User choices (parameters)

ParameterDescription
HazardRiverine flood, tropical cyclone, earthquake or wildfire.
Hazard intensity thresholdThe value marking exposure — e.g. cyclone wind speed, earthquake intensity, flood water depth, monthly burned area.
Event return periodFor floods & cyclones — e.g. exposure to a 100-year event.
Climate scenarioCurrent or future climate (flood & cyclone), e.g. RCP4.5 / RCP8.5.
Aggregation subdivisionsPre-defined admin boundaries (provinces, districts…) or a custom file.
Population dataSource, resolution and any age/gender disaggregation.
Infrastructure layersSchools, hospitals, airports, roads…

Methodology

1

Hazard mask

Compare the hazard raster to the threshold → 1 exposed / 0 not.

2

Overlay population

Project to a common grid and multiply by the population raster.

3

Zonal statistics

Sum exposed population & count facilities per subdivision.

Infrastructure exposure is computed the same way — the number of facilities falling inside the hazard-mask zone. Much of the real work is dataset-specific pre- and post-processing.

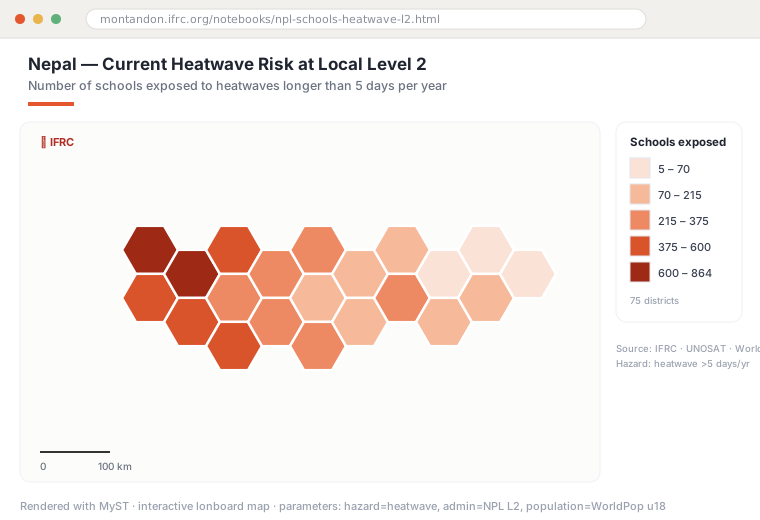
Choropleth of schools exposed to heatwaves per district in Nepal
Notebook output Example — schools exposed to heatwaves per Level-2 subdivision in Nepal (after the MapAction / IFRC analysis).

Scenarios it supports

🌀 Tropical cyclone

Expected frequency of Cat-3+ cyclones per school, current & future climate, to plan educational-facility resilience.

🏚️ Earthquake

List airports, primary roads and warehouses exposed to severe / violent shaking for a logistics plan.

🌊 Riverine flood

Neighborhoods affected under different return periods, plus the share of children & elderly exposed.

🔥 Wildfire

Rural provinces affected over 10 years and the cropland share, to read alongside food-security stress.

Use Case 2 · Impact · during / just after

Post-disaster Impact Estimation

Who and what fall within the observed extent of an actual disaster, using Copernicus remote-sensing products, in the hours and days after it strikes.

Context

In a response’s first phase, a reliable estimate of the affected zone — from remote sensing, before ground surveys arrive — speeds prioritisation. Products from CEMS, the Disaster Charter and others exist, but local responders often want to go more granular and flexible: their own subdivisions, their own disaggregation, their own extra data. This use case makes CEMS the main source and adds custom post-processing.
Data sources

Copernicus EMS Ground-movement raster Burnt-area vector Flooded-area / max extent Building-damage points Transport-network damage WorldPop / GHSL OpenStreetMap GADM / CODs

Covers four hazards: floods, wildfires, storms and earthquakes.

Trigger

Event-driven

Kicked off automatically when a new event / activation appears — see Automation. Re-runs as new CEMS products arrive.

Methodology

1

Observed extent

Take the CEMS vector extent for the event as the impact zone.

2

Intersect

Overlay population & infrastructure; add CEMS damage as a subset.

3

Zonal stats + time

Aggregate per zone; a time slider tracks the impact’s evolution.

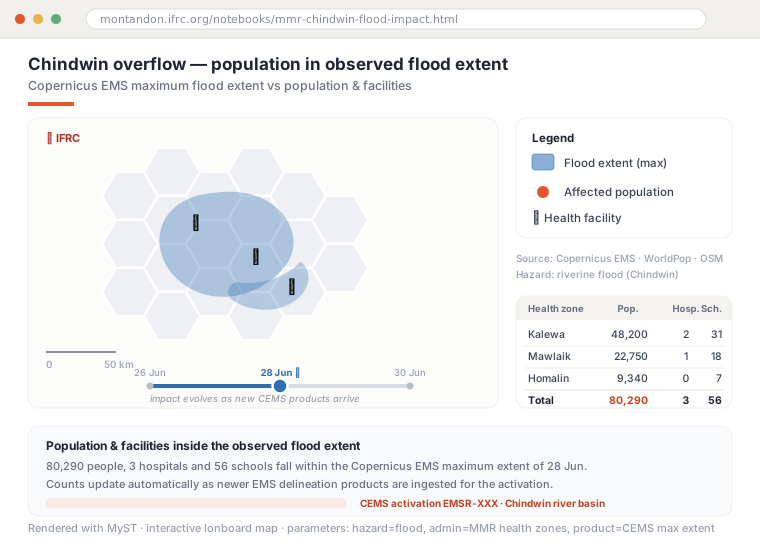
The key differences from Use Case 1: an observed impact zone rather than a baseline hazard, higher resolution & flexibility than the published CEMS summary, and a temporal dimension as a disaster evolves (a flood extent grows, an earthquake has aftershocks).

A rendered notebook showing observed flood extent over admin areas with a time slider and a results table
Notebook output Example — population & facilities inside an observed flood extent, with a time slider across CEMS products.

Scenarios it supports

🌀 Tropical cyclone

Children under 5 per district affected, and schools inside the affected area.

🏚️ Earthquake

Primary & secondary road networks within each intensity zone, for aid delivery.

🌊 Riverine flood

Share of hospitals per health zone inside the maximum flood extent.

🔥 Wildfire

Cropland & population affected, cross-read with food-security stress (IPC).

Use Case 3 · Action · first 24–72 hours

Operational Response Prioritisation

Which affected areas to prioritise — combining exposure, impact, Montandon’s disaster history and operational data — and feeding that prioritisation back to the International Charter.

Context

In the first hours and days, National Societies and IFRC face a triage problem: with limited teams, relief items and DREF funds, where do they act first? Exposure (UC1) says who was at risk; impact (UC2) says where it hit — but neither, alone, weighs observed severity against pre-existing vulnerability, the history of disasters and response, and the operational reality of who is already there. This use case synthesises the outputs of the first two into a transparent, adjustable prioritisation.
Data sources

Montandon · core Charter / CEMS severity INFORM Subnational IFRC GO · ops & capacity Field reports / EOC Accessibility · OSM WorldPop · GADM · OSM

Montandon uniquely supplies the harmonised historical record — past events, impacts and DREF operations for the area.

Trigger & delivery

Auto + writeback

Runs on the event like UC2, and publishes the ranking back to Montandon as a STAC collection — consumable by Charter tools. See Charter integration.

Methodology — component signals, normalised 0–1

Observed severity

EO-derived impact & damage grade intersected with exposed population & infrastructure (Use Case 2).

Vulnerability & coping capacity

The corresponding INFORM Subnational dimensions (Use Case 1).

Historical burden & recurrence

Montandon’s past events, impacts & DREF operations — how often, how hard, how much response.

Operational gap & accessibility optional

Existing National Society & 3W coverage, and remoteness — weighting under-served, hard-to-reach areas.

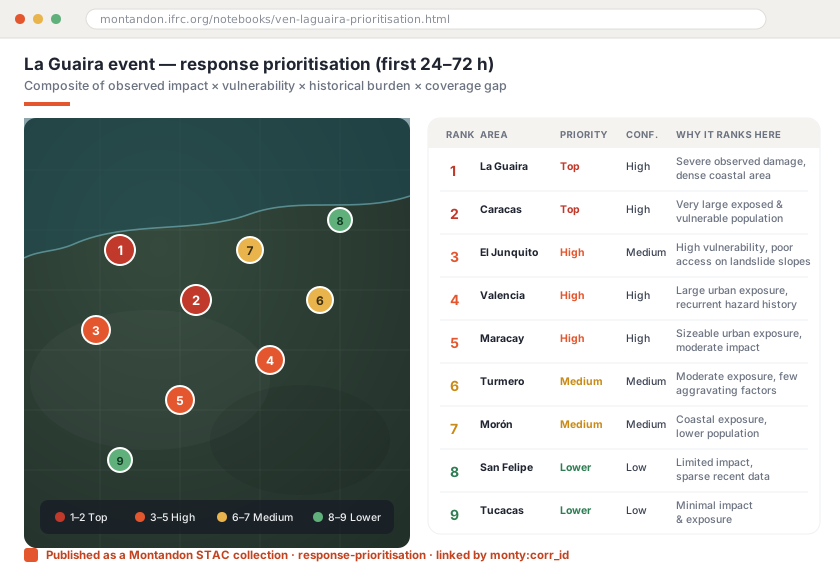
These aggregate into a composite prioritisation index using a transparent weighting (a weighted or INFORM-style geometric mean, so no single dimension dominates). Alongside it, a per-area confidence score reflects data completeness & freshness, and an automatically-produced plain-language rationale explains why each area ranks where it does — keeping the ranking auditable rather than a black box.

A ranked prioritisation map and table of nine areas of interest for a Venezuela earthquake
Notebook output Example — ranked areas of interest for the La Guaira / Venezuela earthquake, with priority, confidence and rationale (illustrative).
Writeback

The output is published as a Montandon STAC collection (response-prioritisation) — one item per ranked area, tied to the event by monty:corr_id, with a derived_from link to the EO response product. A single API call returns the ranked areas with their humanitarian context, ready for the Charter Mapper or a Charter chatbot.

At a glance

How the three compare

① Risk Exposure② Impact Estimation③ Response Prioritisation
WhenBefore an event (baseline)During / just afterFirst 24–72 hours
QuestionWho & what is at risk?Who & what was hit?Where to act first?
TriggerOn-demand, user-drivenAutomatic on new eventAutomatic on new event
Core dataINFORM, hazard layers, WorldPop, OSMCopernicus EMS extents + base layersUC1 + UC2 + Montandon history + IFRC GO
OutputExposure map & tables per zoneAffected-extent map, time slider, tablesRanked areas: priority + confidence + rationale
WritebackSTAC collection back to Montandon / Charter